
Mandelbrot.site


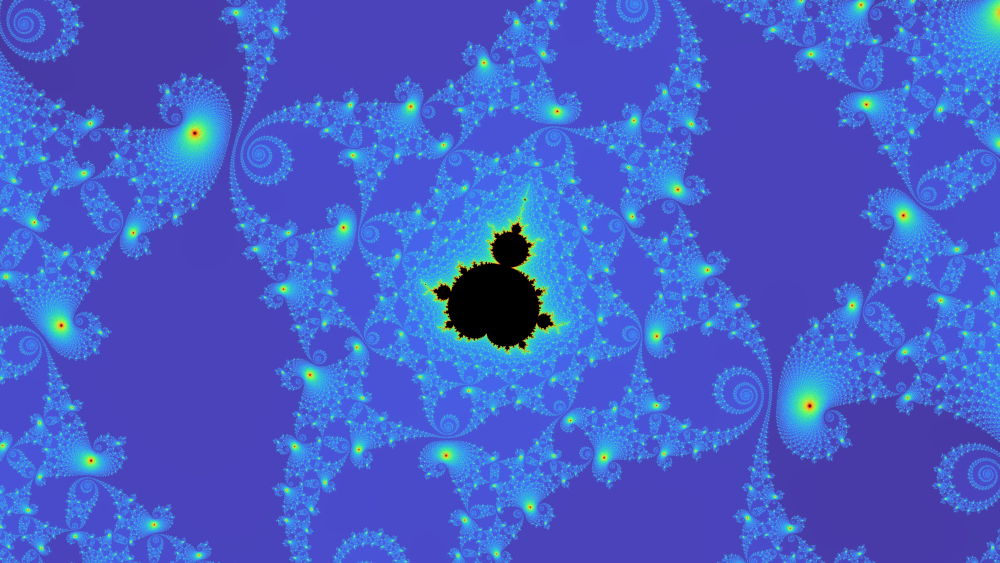
Mandelbrot.site is a web-based viewer that allows users to explore the fascinating world of the Mandelbrot set, a complex mathematical fractal. The project leverages cutting-edge web technologies, including Rust, WebAssembly (Wasm), TypeScript, and Leaflet.js, to create a high-performance, interactive, and visually captivating experience.
The viewer enables users to navigate through different regions of the Mandelbrot set seamlessly, offering features such as dynamic zooming, iteration adjustment, and customizable color schemes. Additionally, users can explore multibrot sets and generate shareable URLs to share their unique fractal discoveries with others.
Under the hood, the application combines the power of Rust for high-performance computations, WebAssembly for efficient execution in the browser, and TypeScript for enhanced frontend development. The integration of these technologies, along with innovative optimizations like rectangle checking and the use of Web Workers, ensures a smooth and responsive user experience.
Mandelbrot.site demonstrates the potential of modern web technologies in creating sophisticated, CPU-intensive applications. It serves as an educational tool, an artistic platform, and a source of inspiration for those interested in the intersection of mathematics, computation, and visual beauty.